Today we will discuss a very cool topic in web analytics – what are heat maps, click maps, or as they are also called, heatmaps, how they work, and we will also give a few examples of services for implementation.
What are heat maps?
Heat maps (click maps) are a web analytics tool for measuring website usability, including clicks, cursor hovering, and page scroll depth. It is a very powerful tool, the successful implementation of which answers many questions: “where to place a particular button,” “why a function is not working,” “what causes a user to leave the website,” and “how engaged are visitors to the website?”
The only obstacle to implementing a click map on a website is that it usually requires connecting a script, which typically has a negative impact on performance.
If Google Analytics, Google Tag Manager, or Facebook Pixel are already connected to the site, be sure to test the performance of both the desktop and mobile versions of the site after implementing the heatmap. If the performance drops sharply and the script really overloads the system, you will have to decide to abandon the service and start testing other options.
Also, keep in mind that to install the script, you need access to files on the hosting or server . So if you wanted to see your competitors’ heatmaps, unfortunately, you won’t be able to do that.
Types of heat maps
Experts distinguish four most common types of website heat maps.
- A click map is the most popular type of heat map. It allows you to find out which elements of the page users click on most often. It helps to identify the popularity of specific buttons, banners, links, etc. Ideally, the concentration of clicks (red spots on the map) will always be on the “Call to Action” element. Usually, this is a button that leads to conversion.
- A mouse activity map is somewhat similar to the previous one. However, it shows which elements the cursor was hovering over without clicking. This can be useful for online stores where it is possible to enlarge photos without clicking on them. This will help you understand whether buyers are using this feature.
- The scrolling map shows how far users scroll through your pages. Its analysis can be useful for landing pages, informational, media, or product pages. These maps show where your site visitors’ attention is focused and where it begins to wander. Analysis allows you to identify the most readable parts of the pages. You can place particularly valuable information and calls to action there so that the reader will definitely see them.
- A session recording is a complete record of user behavior on a website, capturing their clicks and movements. It can provide useful information, but this method is quite difficult to use, as it requires reviewing thousands of recordings that can last from a few minutes to several hours (if, for example, a person forgot to close the tab).
How to choose a heat map for a website?
The right choice of heat map will help improve the UX of the website, increase conversion rates, and speed up problem solving. All this is possible thanks to the correct analysis of user behavior.
To ensure that the heat map data you collect is accurate, you need to have a sufficient sample size. We recommend at least 2,000-3,000 page views per screen from each device, or 80% of all your views.
Here’s what to look for when choosing a heat map tool:
Identify the problem you are trying to solve. This will help you understand what kind of heat maps you need (click tracking, scroll depth, mouse movements, etc.) and weed out services that don’t provide the features you need.
Who will be using the software? The answer to this question will help you understand what to prioritize: ease of use for everyone or speed for a small group of professionals.
Performance. What we mentioned above. If using the tool causes your site’s performance to drop, it is better to abandon it.
User segmentation. Good software will allow you to compare the actions of different groups of users on your site.
What services can be used to create heat maps for a website?
We have analyzed the most popular tools that allow you to study user behavior on your website. Let’s take a closer look at each of the heat map services.
Hotjar
This resource allows you to use many different elements for analytics. These include click heat maps/scroll maps and recordings of user behavior on the site. You can compare the actions of users from different devices: desktops, mobiles, and tablets.
For an additional fee, you can also set up feedback. For example, ask people what they don’t like and what they would like to change.
Starting with the “Business” plan, you can filter and segment data by session duration, browser version and language, operating system, and more.
To start using the service, you need to install a script on your website. You can do this manually, through Google Tag Manager, your website builder, or CMS (WordPress, Joomla, Magento, etc.). Instructions for installing the Hotjar code on your website can be found here.

Trial period
Each new account gets access to advanced features for 15 days. No payment details are required, and there are no automatic charges. At the end of this period, you can choose a pricing plan or continue using the free version.
What you get for free
The service will analyze up to 35 sessions daily and store the information for one year. Hotjar also allows you to create 3 surveys and 3 widgets for free to get feedback from users. However, it will store no more than 20 responses per month.
Please note! To obtain reliable information, it is recommended to track at least 80% of your users, so the starting “Basic” plan may not be enough.
Cost
The cost of Hotjar’s paid versions varies depending on the number of daily user sessions and functionality. The monthly fee can range from €39 to €827 and above. However, a 20% discount is available for annual payments.
The largest plan, “Scale,” accommodates 500 to 270,000 daily sessions.
Lucky Orange
A useful service that creates dynamic heat maps of visitor activity on the website. Among the company’s clients are Vodafone, Adobe, and Nasdaq. It allows you to use session recordings, heat maps, user chats, surveys, and more for analytics.
Lucky Orange’s analysis includes clicks on dynamic elements (pop-ups, menus, and forms). You can set up filters for specific user actions, such as rapid scrolling or a series of angry clicks.
You can share heat map screenshots with your team.

Trial period
For 7 days, you can access all tools and integrations (WordPress, Google Analytics, HubSpot, Shopify, and others). No credit card details are required. If this is not enough time, you can continue working for free, but with limitations.
What you get for free
Free use of Lucky Orange gives you access to all features. However, you will only receive data based on the analysis of 100 sessions per month. This data will be stored for 30 days.
Cost
Lucky Orange pricing plans differ in the number of sessions that can be analyzed each month: from 5,000 (Build plan) to 300,000 (Scale plan). The cost ranges from $39 to $749.
When paying annually, the monthly cost will range from $32 to $600. Data is stored for 60 days. You can also personally negotiate an increase in the data storage period for an additional fee.
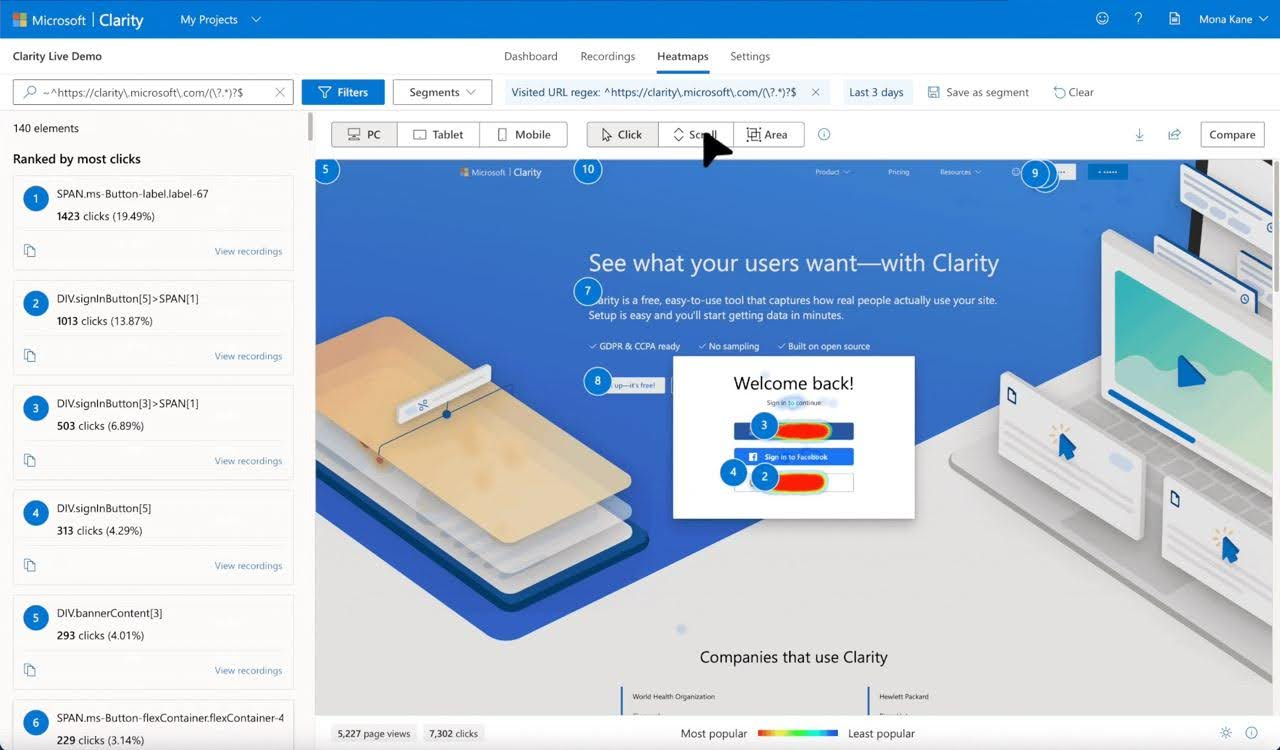
Microsoft Clarity
This resource has one significant advantage over all others. We are talking about the price, or rather the lack thereof. It can be used absolutely free of charge and without restrictions on traffic, number of sites, heat maps, or team members.
Why don’t you have to pay?
The Microsoft Clarity website explains that Microsoft processes a huge amount of data about user behavior from around the world. This provides valuable information that helps improve the machine learning models that underpin many of its services.
This makes it clear that the data obtained from your website will also be used by Microsoft. Therefore, you don’t need to pay anything. At the same time, they assure you that no one other than Clarity will see your data.
There are three ways to integrate Clarity heat maps into your website:
- by inserting code into the <head> HTML page;
- using a WordPress plugin;
- through Google Tag Manager.
Integration with additional tools is also possible.
What you can get for free
So, with Microsoft Clarity, you can get user session recordings, work with multiple domains, conduct A/B testing, and most importantly, create:
- click heat maps that show the elements with the highest engagement levels;
- scroll heatmaps that show how far your users scroll;
- zone heatmaps that show the total number of clicks in a selected area of the screen.
This tool will also generate a list of the most engaging elements for each page and suggest user segmentation (in particular, by device, browser, OS, country, and even city). Integration with Google Analytics is possible.
Among the disadvantages noted by users, it is worth highlighting that it is impossible to disable session recording on Microsoft Clarity. This means that even if heat map analysis is sufficient for you, behavior recording will still be performed, which may affect website performance.
At the same time, the company itself claims that its heat maps do not slow down websites because they use data that Clarity has already collected.
Session recordings are only stored for 30 days. However, some of them can be added to favorites, which will help store data for 13 months. In addition, users note that the Microsoft Clarity interface is not very convenient when compared to Hotjar or Lucky Orange.
Crazy Egg
This service really has several features that its competitors don’t have. In particular, the Confetti filter, which segments users from different traffic channels.
However, let’s immediately point out four main pitfalls:
- the registration process is inhuman;
- statistics are not collected from dynamic elements (menus, forms);
- there is an error on sites with adaptive layout;
- you can only work with screenshots, not with a “live” site.

Trial period
After registering, Crazy Egg gives you the opportunity to use any of its pricing plans free of charge for 30 days. However, you must provide your credit card details.
It is also important to keep track of the trial period yourself. The Crazy Egg website warns that they do not notify users when the trial period ends. Therefore, you need to cancel your subscription yourself, otherwise you will be automatically charged for the next month or year, depending on the plan.
At the same time, if there are insufficient funds on your card to pay for the plan, the service will not even allow you to complete the registration.
Advantages of the resource
In addition to the features mentioned in the previous services, Crazy Egg has several features that experienced users will particularly appreciate. This resource is considered one of the best for conducting A/B testing. Random users are shown different versions of the site, and then their reactions are used to determine which option is best.
Also, a few words about the aforementioned “Confetti.” This tool allows you to segment users and analyze their behavior. For example, you can find out how people who came from a search behave on the site, and how social media subscribers behave.
To start working with Crazy Egg, you need to add its snippet to your website. The service has prepared special guides for more than 20 different platforms. These include WordPress, Google Tag Manager, Shopify, Wix, Magento, Drupal, Joomla, Segment, and others. They also offer to contact them by email if there is no guide for your platform.
Cost
Depending on the features included in the plan, monthly use of Crazy Egg will cost between $49 (75,000 page views per month) and $249 (500,000 page views per month) if you pay for a year in advance.
Mouseflow
This service has received many positive reviews from users. Among its advantages are the analysis of the effectiveness of your website’s dynamic content, such as sliders, menus, etc. Mouseflow also offers a scroll depth analysis feature that helps you understand how effective your landing pages are.
Click maps, scroll maps, cursor movement maps, and zone maps are available, along with session recordings and sales funnel analytics.
To add Mouseflow to your website, you need to copy a code snippet and install it on the pages you are interested in. It can also be integrated with the most popular website builders and CMS.

Trial period
Any of the service’s pricing plans can be used free of charge for 14 days. You do not need to provide credit card information for this period. After that, you will be offered to use the free version or pay for one of the more advanced ones.
What you get for free
If you plan to use Mouseflow for free, you can expect 500 session recordings per month on one website and data storage for 30 days.
Cost
Depending on the plan you choose, you can increase your options. The service will make 5 to 150 thousand session recordings, analyze 1 to 10 websites, and store data for 3 to 12 months. And after a personal agreement, even the above resources can be increased. Of course, for an additional fee.
For paid versions of Mouseflow, you will need to pay from €39 to €499 per month. When paying for a year, the monthly price will be from €31 to €399.
How to minimize the impact of heat maps on website loading speed
We suggest paying extra attention to a few tips that will reduce the impact of heat maps on your website’s loading speed.
- Choose a tool with a script that loads asynchronously. This way, it will not interfere with the website loading its resources.
- To maintain your script, the service should use a CDN (Content Distribution Network). Then the script will be loaded from the server closest to the user. For your part, it is advisable to connect at least the free Cloudflare tariff.
- Enable caching at both the server and client levels.
In conclusion
Heat maps are an extremely useful tool that will help you analyze user behavior and improve the performance of your website.
When choosing a service that allows you to create heat maps, it is important that it does not slow down your website. Also, focus on the functionality that is offered to you, because not all tools may be useful in your particular case.
Don’t forget that most services offer free use. However, in this case, you will usually receive insufficient information for in-depth analysis. So you will have to accept that you will need to pay or share information, as is the case with Microsoft Clarity.